
As we saw in our last post on the Top Ten Reasons Papers Get Rejected, errors in statistical analysis are among the most common grounds for rejection. Errors in the interpretation of the p-value, in particular, have long been acknowledged and unfortunately persist in scientific literature. In this article, we cover 5 of the most widespread misconceptions surrounding this statistical tool.
The Origin of the P-Value
The p-value was popularized in research in the 1920s by British statistician Sir Ronald Fisher. It was originally meant to serve as a rough numerical guide to help scientists decide which data to take seriously. Around the same time, the theory of hypothesis testing was developed by Jerzy Neyman and Egon Pearson. In hypothesis testing, data sets are compared, and a hypothesis is proposed for a relationship between variables. This hypothesis is then considered as an alternative to the default hypothesis of ‘no relationship’, which is known as the null hypothesis.
Researchers soon began combining the p-value with hypothesis testing, a method that is today widely used to accept or reject scientific hypotheses. By convention, a p-value of 0.05 is used as the cut-off point below which results are considered statistically significant.
Interestingly, what Fisher meant by ‘significance’ was simply that the data were interesting and worthy of further experimentation. Little did he know that his concept would spiral out of control.
P-Values vs. Statistical Power: What’s the Difference?
While p-values assess the likelihood of observed results under the null hypothesis, statistical power refers to the probability of detecting an effect when one truly exists. Low statistical power increases the risk of Type II errors—failing to detect a real effect.
High-powered studies (with sufficient sample size) are more likely to produce reliable p-values and reduce false negatives. Researchers should consider both p-values and power when designing studies and interpreting results.
The Problem with the P-Value
Today, the 0.05 value has become a type of ‘magic threshold’ or ‘limbo bar’ that endows scientific results with importance if they manage to pass below it. Results that don’t pass this arbitrary cut-off value are deemed ‘insignificant’ and hidden away, never to see the light of publication.
The need for small p-values to validate the significance of research has even led some to ‘p-hacking‘. This regrettable practice, also known as ‘data fishing’ or ‘snooping’, involves fiddling with data in order to attain low p-values. This, essentially, is cheating.
Seeking to eradicate such abuses, some journals have officially banned the use of the p-value, but not everyone agrees with taking these measures. Some argue that abolishing the p-value is akin to ‘throwing the baby out with the bathwater’, and it would be better to guide its proper use and limitations, instead.
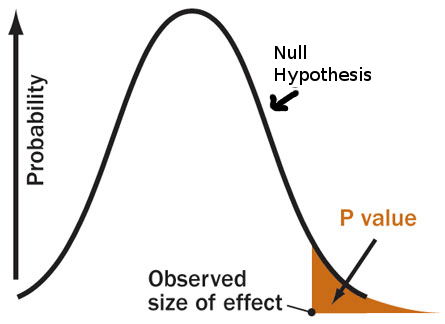
Below are five of the most common errors surrounding the p-value. To better understand them, it will be useful to keep in mind the following definition:
The p-value is the likelihood of obtaining the observed, or more extreme, data results when the null hypothesis is true.
Why P-Values Are Often Misused
One key reason why p-values are misunderstood lies in how they are taught. In many educational settings, statistical concepts are rushed through, leading researchers to rely on rules of thumb, like the p-value threshold of 0.05, without understanding the reasoning behind them. This superficial understanding creates a dangerous situation where statistical tests are used as binary decision tools, rather than as part of a broader inferential process.
Moreover, the growing pressure to publish significant results in academia has contributed to the misuse of statistical tools. When researchers are incentivized to find low p-values at all costs, the likelihood of data manipulation, selective reporting, and misinterpretation increases.
Understanding that the p-value is not a magical number but part of a larger scientific framework is essential for producing trustworthy research.
Common Misconceptions about the P-Value
-
The p-value is the probability that the null hypothesis is true.
Wrong. As we can see from the above definition, the p-value already assumes that the null hypothesis is true. For this reason, the p-value is also not the probability that the results are due to chance. In assuming the null hypothesis is true, the p-value considers chance as the only reason for the differences observed.
-
A low p-value indicates that the alternative hypothesis is likely true.
A p-value below 0.05 does not automatically mean the alternative hypothesis is true. Low p-values suggest that the observed results are not consistent with what would be expected if the null hypothesis were true. The p-value alone cannot distinguish between unusual test results and a truly false null hypothesis.
-
The p-value reflects the clinical importance of an effect.
The p-value says nothing about the size of an effect or about its clinical importance. In very large studies, even small effects may gain statistical significance. For example, in a trial comparing two treatments against hypertension, patients receiving Drug A may have significantly lower blood pressure than those receiving Drug B. However, the difference might be so small that it doesn’t make a clinical difference for the patients.
Alternatively, in small studies, even big effects may be drowned in noise.
-
If the same hypothesis is tested in different studies and the p-value is above 0.05 in all or most of them, it is safe to conclude that there is no evidence of an effect.
False. Absence of evidence is not evidence of absence. Even when individual studies have p-values above the statistical significance level, it does not mean that when taken together, they might not reveal a statistical significance. For this reason, it is important to properly conduct a meta-analysis when considering the overall evidence of several studies.
-
Scientific conclusions should be based on the significance of the p-value.
The Role of Confidence Intervals in Interpreting P-Values
Confidence intervals provide more information than a p-value alone. While a p-value only tells you whether an effect is statistically significant, a confidence interval gives you a range of plausible values for the effect size.
For example, a 95% confidence interval that does not cross zero suggests a statistically significant effect, but it also shows the possible range of outcomes. Wider intervals indicate less precision, often due to small sample sizes. Researchers are encouraged to report both p-values and confidence intervals for a fuller picture.
Understanding the Relationship Between Sample Size and P-Values
Sample size plays a critical role in determining p-values. Larger sample sizes reduce random error and increase the sensitivity of statistical tests. This means that even very small effects may become statistically significant in large samples, potentially misleading researchers about their practical relevance.
Conversely, small sample sizes may fail to detect meaningful effects, leading to non-significant p-values despite real-world importance. It’s essential to interpret p-values in context, alongside sample size, effect size, and study design.
P-values are elusive, and they are often difficult to replicate. Therefore, it is important not to base a scientific conclusion solely on the significance of the p-value. “The p-value was never intended to be a substitute for scientific reasoning,” warned Ron Wasserstein, executive director of the American Statistical Association. It was simply meant as one way of supporting a conclusion.
How to Use P-Values Responsibly in Research
Responsible use of p-values starts with understanding their limitations. P-values should never be used as the sole criterion for making scientific decisions. Instead, they should be part of a broader assessment that includes study design, effect sizes, prior evidence, and biological plausibility.
Researchers should also pre-register studies and analysis plans to prevent data dredging. When possible, use replication studies and meta-analyses to strengthen findings. Transparency and full reporting of all results, whether significant or not, help reduce publication bias and enhance the reliability of the scientific literature.
The p-value in itself is not evil, but over-reliance on it can cloud judgment by providing a false sense of certainty over the validity of results. Being more discerning in the use of the p-value and considering other statistical metrics, like confidence intervals, are some of the proposed solutions to the p-value problem.
In the words of Ron Wasserstein, “Well-reasoned statistical arguments contain much more than the value of a single number and whether that number exceeds an arbitrary threshold.”
These are only a few of the most common errors in p-value interpretation. If you would like to learn more, take a look at these articles from Greenland et al, Goodman S, and Jennie Dusheck from Stanford Medicine.
– Written by Marisa Granados, Research Medics Editorial Desk